

If you’re responsible for patient flow, bed management, or discharge throughput, you already know the problem: patients move through your facility constantly, but your operational picture of where they are and what’s happening to them is almost always delayed, incomplete, or siloed. You’re not really asking for “location.” You’re asking for reliable patient movement events that support bed assignments, transport coordination, room turnover, and downstream discharge planning.
That’s the real job of tools to track patients from admission to discharge. Real-time locating systems (RTLS) are local tracking systems that identify the physical locations of personnel and equipment in real time. But the clinical operations teams getting the most value from RTLS aren’t treating it as a map. They’re treating it as an operational data layer that feeds their entire patient journey workflow.
This guide covers exactly that: how admission-to-discharge patient tracking works in practice, what to look for in a tool, how to connect it to operational systems like EHRs, and how to measure whether it’s actually working.
Admission-to-discharge tracking: what you’re really trying to solve
The gap between floor-level visibility and room-level certainty matters more than most people expect. Knowing a patient is “somewhere on the 4th floor” doesn’t tell you whether they’ve arrived in their assigned room, if they’re still in imaging, or whether their bed is now ready for the next admission. Room-level certainty gives you the event precision clinical workflows depend on.
Kontakt.io’s beam-based RTLS supports two accuracy tiers: 15-30 ft accuracy with 3-60 second latency using BLE-enabled Wi-Fi access points, and room-level certainty with under 5 seconds latency via battery-powered Portal Beams or Mini Beams. For patient flow optimization with RTLS, that second tier is the one that changes operations. A 5-second update when a patient crosses a room threshold is what lets you automate a bed-request trigger or notify housekeeping without a phone call.
It’s also worth being clear about what RTLS actually is: a signal plus infrastructure plus a software workflow layer. Hardware alone doesn’t reduce ED boarding. The location data has to flow into the right operational systems, trigger the right events, and surface in the right places for the right staff. That’s the system design problem, and it’s what separates a tracking tool from an operational platform.
What counts as an admission-to-discharge tracking tool? A practical checklist
Not every RTLS product is built for the admission-to-discharge use case. Some are designed primarily for asset management, others for safety alerting. When you’re evaluating tools specifically for patient journey tracking, here’s what to look for:
Core capabilities your tool must have:
- Continuous tracking with no dead zones across inpatient, ED, imaging, surgical, and transitional care areas
- Visit/encounter association so location events tie back to a specific patient admission, not just a device ID
- Status change events: arrived, in room, in transit, transfer complete, ready for discharge, departed
- Audit-ready location history you can query by patient, room, or time window
- Fast update latency (under 5 seconds for room transitions, not minutes)
Must-haves for patient flow and capacity leaders:
- Room-level accuracy, not zone-level (zone data doesn’t reliably distinguish “in the room” from “in the hallway outside the room”)
- Event completeness: what percentage of room entries and exits are captured? Missing events break downstream workflows
- Integration into operational tools (bed management boards, transport dispatch, EVS coordination), not just standalone dashboards
- Configurable geofences with automated alerting so staff aren’t manually watching a map
Questions to ask any vendor:
- What’s your room-level certainty percentage under realistic hospital RF conditions?
- What’s the average latency from physical room entry to event generation?
- How do patient location events connect to ADT status updates in our EHR?
- What’s your typical time to live in a 100-200 bed deployment?
- Can your infrastructure run on our existing Wi-Fi, or does it require new cabling?
Reviewing top mistakes to avoid when choosing an RTLS solution before you evaluate vendors is worth doing. Several of the most common errors come down to choosing zone-level tools for workflows that need room-level precision.
The RTLS toolkit: hardware + infrastructure + software (how the pieces fit)
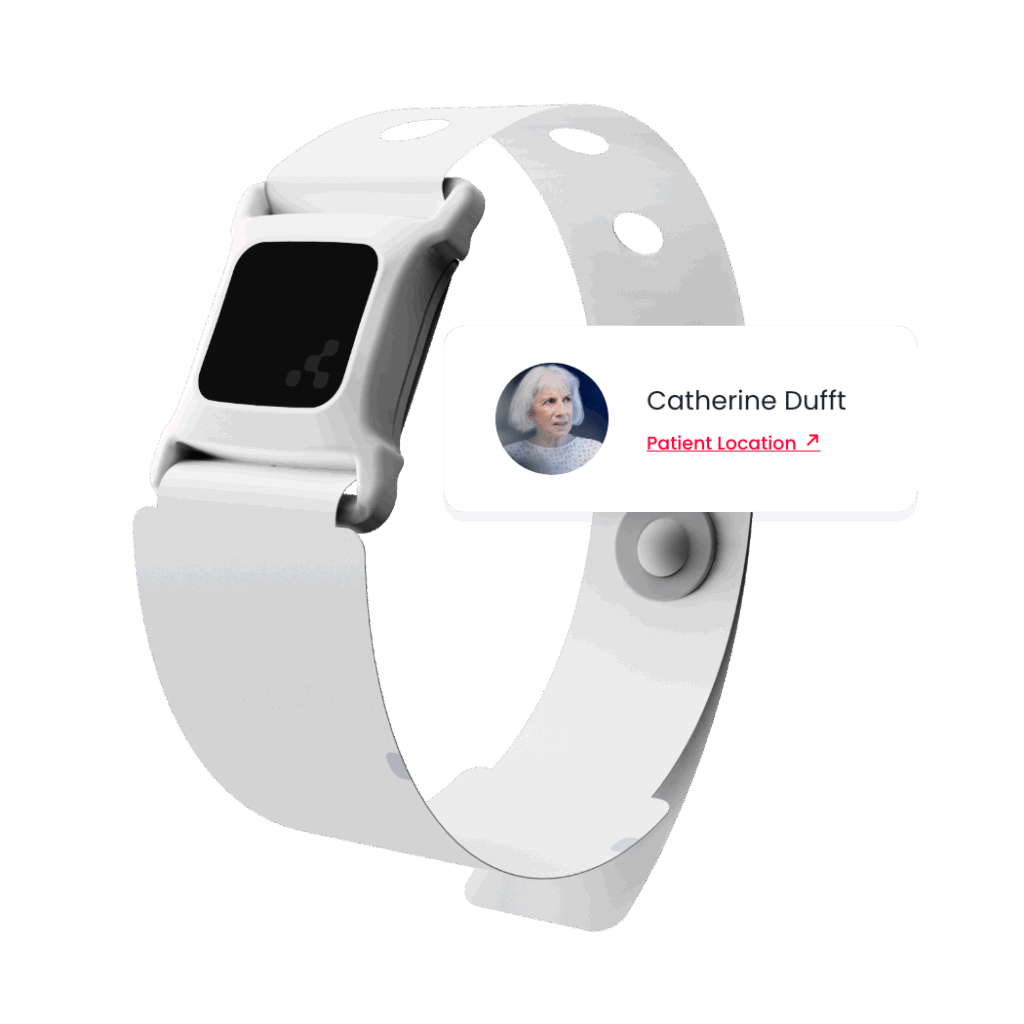
Admission-to-discharge tracking runs on four layers: patient wearables (BLE nano tags on hospital wristbands, tied to a patient encounter), location sensors (Portal Beams and Mini Beams in individual rooms, which is where room-level certainty lives or dies), a location engine that processes signals on-device and sends derived telemetry to the cloud, and an application and integration layer that turns location events into bed turnover triggers, transport notifications, and status board updates in your EHR.
Each layer maps to one part of the outcome: the wearable enables the location event, the sensor defines the room boundary, the engine generates the status change, and the application puts it in front of the right person at the right time. Kontakt.io’s platform is designed to work with existing network infrastructure, including BLE-enabled Cisco Catalyst access points, so you’re not always starting from a blank slate.
Application and integration layer
This is where tracking events become operational actions: bed turnover triggers, transport notifications, discharge confirmations, staff coordination alerts, and status board updates. This layer connects to your EHR, bed management system, and EVS dispatch tools.
Each layer ties to a specific patient journey tracking outcome. The wearable enables the location event. The sensor defines the room boundary. The engine generates the status change. The application puts it in front of the right person at the right time.
Safety and flow: one workflow layer, multiple use cases
One of the structural advantages of a platform approach to patient tracking is that safety use cases and flow use cases share the same underlying location data. Elopement prevention isn’t a separate system; it’s one event type in the same patient journey visibility engine.
When a patient with an elopement risk designation crosses a configured geofence boundary, an instant alert fires to security and nursing. That same geofencing capability, configured differently, fires an alert when a patient leaves imaging and is ready for transport back to their room. Same infrastructure. Different rules.
Wandering and patient monitoring for at-risk patients (those experiencing confusion, dementia, or post-surgical disorientation) benefits from the same room-level certainty that bed management depends on. The difference is in the alert logic and the recipient, not the underlying sensor network.
This matters for ROI framing. When you build the business case for RTLS patient tracking, you’re not buying separate systems for elopement, transport coordination, and bed management. You’re buying one operational data layer with multiple configurable workflow outputs. The same deployment that reduces ED boarding also supports patient safety compliance requirements.
Integration to EHR and operational systems: where tracking becomes actionable
Location data is only operationally useful if it reduces manual clicks and phone calls for the staff who act on it. That’s the integration imperative.
The practical result: when a patient physically arrives in their assigned room, that event can update their status in EHR without requiring a nurse to manually document the transition. When a patient’s room is vacated, that event can automatically notify EVS without a phone call.
For patient flow and capacity leaders, the integration footprint typically needs to cover:
- ADT (Admit, Discharge, Transfer) status synchronization so location events and EHR records stay aligned
- Status boards and bed management whiteboards that reflect real-time patient location rather than manually entered status
- Transport dispatch workflows triggered by location events (patient ready in room X, transport needed to imaging)
- Operational reporting dashboards that pull location event data alongside clinical metrics
The EHR + RTLS integration approach that delivers the most operational value is one where location signals reduce the information latency between what’s physically happening on the floor and what operational systems know about it. The goal is fewer phone calls, fewer manual status updates, and fewer delays caused by someone not knowing where a patient actually is.
What to measure: the KPIs that prove admission-to-discharge tracking works
Deploying RTLS without a measurement plan is how facilities end up with tracking data they don’t act on. Here’s a practical framework for connecting your deployment to outcomes.
Primary throughput KPIs:
- Room turnover time (bed vacated to next patient admitted): baseline vs. post-deployment
- ED boarding hours: time from inpatient bed assignment to physical patient arrival in room
- Time-to-transport: interval between transport request and patient pickup
- Rounding compliance: percentage of scheduled patient rounds completed on time
- Before-noon discharge rate: a leading indicator of daily bed capacity
Data quality metrics (often overlooked):
- Event completeness rate: percentage of room entries and exits captured vs. expected
- Latency by event type: how quickly does a room-entry event appear in operational systems?
- False positive alert rate: how often do elopement or geofence alerts fire incorrectly? High false positive rates kill staff adoption
A baseline-to-scale measurement template:
- Baseline (pre-go-live): pull 60-90 days of historical data on your target KPIs using EHR records
- 30-day checkpoint: validate event completeness and latency. Fix any sensor coverage gaps. Don’t optimize workflows yet
- 60-day checkpoint: measure primary throughput KPIs against baseline. Identify which journey segments show the most improvement and which still lag
- 90-day checkpoint: quantify operational impact. Calculate bed-days recovered, transport delay reduction, and any measurable LOS contributions. Use this to build the scale-up business case
Kontakt.io’s Intelligent Orchestration framework (RTLS + EHR + predictive and agentic AI) claims up to 30% reductions in patient wait times. The baseline-pilot-measure approach above is how you verify those claims in your specific environment rather than accepting vendor benchmarks as given.
For a deeper look at how analytics connect to these metrics, patient journey analytics can help you fuse clinical context from your EHR with real-time location signals to identify where your specific patient journey is losing time.
Implementation roadmap: pilot to scale
The biggest implementation risk isn’t technical. It’s scope creep and stakeholder misalignment in the first 90 days. A phased approach protects against both.
Step 1: Define your high-value journey segments
Don’t try to instrument everything. Start with the segments that drive your biggest operational pain: ED-to-inpatient transfer, imaging/diagnostics roundtrip, and discharge preparation. Each of these has a measurable bottleneck you can size before deployment.
Step 2: Deploy infrastructure for room-level certainty
Kontakt.io’s room sensor installation averages 6 minutes per room. A 200-bed deployment takes approximately 20 hours (around 2.5 working days). That’s a meaningful difference from legacy RTLS infrastructure projects. Map your target units, identify rooms needing dedicated beams vs. rooms covered by existing Wi-Fi access points, and set a realistic go-live timeline.
Step 3: Configure event rules, geofences, and staff workflows
Room boundaries need to be mapped and validated. Geofences for elopement risk patients need to be defined with nursing. Transport trigger logic needs to be reviewed with your transport team. This is the step most often rushed, and it’s where false positive rates get set (badly or well).
Step 4: Integrate, train, and run a controlled pilot
Start with one unit or one patient population. Confirm ADT synchronization is working. Train charge nurses and EVS coordinators on what automated notifications look like and what to do with them. Run for 30 days before expanding.
Step 5: Scale by unit and expand use cases
Once your pilot unit shows clean event completeness and measurable throughput improvement, the scale case is straightforward. Add units, add use cases (safety, navigation, bed management), and connect additional operational systems. The rapid room turnover workflow is a natural next expansion once your room departure detection is reliable.
Common concerns: accuracy, privacy, and workflow adoption
On accuracy and latency:
Zone-level RTLS (15-30 ft accuracy, 3-60 second latency) works fine for some asset tracking use cases. It doesn’t work for admission-to-discharge patient tracking. Room-level workflows break when a system can’t reliably distinguish a patient in Room 412 from a patient in the hallway outside Room 412. Kontakt.io’s Portal Beam architecture uses room logic based on room ID rather than XY coordinates or zone polygons, and cites room-level certainty figures exceeding 99% under reference architecture conditions. Ask vendors for their specific accuracy methodology, not just a percentage.
On privacy:
Patient location data carries real privacy considerations. Kontakt.io’s approach uses on-device processing and local discarding of raw thermal images. What gets transmitted to the cloud is derived telemetry (occupancy predictions and location events), not identifiable sensor images. That architecture limits the exposure of raw patient movement data at the edge. Data is stored for up to one year and is retrievable via REST API for operational reporting and audit purposes. When evaluating any RTLS platform, ask specifically how raw sensor data is handled, where it’s stored, and what access controls exist.
On workflow adoption and alert fatigue:
RTLS implementations fail in operations, not in technology. The most common failure mode is high false positive alert rates leading staff to disable or ignore notifications. Prevention comes from proper geofence configuration before go-live, a 30-day data-quality-only period before operationalizing alerts, and involving charge nurses in threshold-setting decisions. Staff should control alert routing, not just receive alerts they didn’t ask for. The IoT and RTLS hospital workflows that sustain staff adoption are the ones designed with nursing input from the configuration phase, not retrofitted after complaints.
If you’re thinking about where to start, the most productive first conversation isn’t a technology demo. It’s a workflow mapping exercise: which journey segments in your facility are generating the most boarding hours, the longest transport delays, or the most manual status-update burden? That’s where tracking infrastructure pays off fastest.
Contact us to talk through your specific admission-to-discharge journey stages and what operational predictability could look like in your facility.