Latest Bluetooth beacons bring new level of automation, transparency, and ease of use to heatmapper technology.
Table of contents
- Heatmapping
- Why Not Use a WiFi Heatmapper?
- How to Create a Better Heatmapper with Beacons
- Beacons Need Gateway for Better Heat Map Generation
- Use our API to build up your platform
Heatmapping is a common tool for retailers, but it also offers huge possibilities for companies in other verticals. Heatmaps can help managers visualize all the valuable data they’ve collected and turn it into actionable information. Manufacturers, transportation operators, and nearly every other field can benefit from proper data visualization techniques–and our latest technology was developed to help you achieve that.

The factory floor can be a crowded place. With so many layers, assets, and movements, it can be nearly impossible to determine what kind of inefficiencies are occurring. Pinpointing exactly how to change and optimize processes includes a lot of guesswork, and analyzing success can also be difficult.
A heatmapper can help:
- Locate bottlenecks
- Better allocate resources
- Quantify efficiency
- Reduce wasted time
- Highlight missed opportunities
For example, a bicycle manufacturer suspects there is inefficiency in their factory. They install beacons to track the movements of assets and employees. The collected data is then turned into a handy heatmap, showing the less popular areas as well as areas with exorbitant dwell times.
Heat mapper technology shows that the first two stations have low to average dwell times with assets spending only a few minutes at each station. However, they spent markedly high amounts of time at the third station. The manager realizes it is likely that this station is simply too crowded andbusy. They choose to divide tasks at the station into two areas. That means evening out the production process and assessing resource and employee allocation. Without analysis, they may not have recognized the imbalance.
Heatmapping
A heatmap takes data and turns it into a visualization, using color to denote how long a person or object is present in a certain area. This can provide insights into common routes as well as which areas are more or less commonly occupied. To create a heatmap, all you need is the right data and wireless survey tools.
Heatmaps can be generated using a number of different heatmapping software. Some of the most popular wireless survey tools include:
- Active RFiD
- UWB
- Zigbee
- Ultrasound
- Infrared
- WiFi

Why Not Use a WiFi Heatmapper?
Looking for the best WiFi mapper? There’s new technology that can do more and costs less.
WiFi mapping does seem very attractive at first. WiFi penetration rates are incredibly high, and users are already accustomed to using and activating WiFi. However, WiFi mapping also suffers from a large price tag. WiFi survey systems are popular but not easy or cheap to maintain. Funding installation, routers, providers, and electricity quickly leads to a much larger pricetag than anticipated.
WiFi solutions require expensive hardware and even more expensive software. Beacon hardware is not only more affordable, but built-in capabilities like those provided by Kontakt.io make the digital conversion of data to heatmap automated and cost-effective. Popular Wifi-based heatmapping solutions can come with an estimated $120,000 hardware costs with an added $36,000 fee for software. A similar system powered by Kontakt.io beacons cut that by nearly 70%. That’s an estimated $25,900 hardware cost with $12,000 for similar software.
Unlike other wireless survey tools and Wifi survey systems, Bluetooth benefits from similarly large penetration rates and a comparably small pricetag. They are small, cost effective, and require little further investment. Bluetooth is also incredibly energy efficient, meaning a Bluetooth-based system can run longer on less energy.
Wireless heatmapper site survey software can provide valuable results but also require extensive resources. Using battery-powered tags allows assets and people to move while still being tracked. These tags, however, often have extremely short battery lives. If used continuously, they will likely require recharging on a daily basis. This strategy can be built into the daily employee schedule, but there are also methods that require less work on a daily basis. Bluetooth beacons, for example, can last anywhere from 6 months to 6 years or more.
How to Create a Better Heatmapper with Beacons
It’s time to upgrade your old WiFi heatmapper technology.
Bluetooth beacons, alone, cannot create a heatmap. They’re just small connectors sending radio waves to passing smart devices. All those interactions, however, can be leveraged to generate rich and thorough data. More importantly, some beacon hardware is made specifically to turn those interactions into visualizations and heatmaps–no further heat mapping software or expensive WiFi coverage needed.
Beacons can be attached to walls and create a grid similar to maps generated by WiFi site survey software, or they can be attached to assets or passers-by to create a more active map. In this second scenario, technology like the Kontakt.io Card Beacon is particularly useful. These beacons are crafted to be small and mobile. (Read more about beacons!)
The most important step is the data creation. Data has traditionally been collected through a smart device equipped with an app designed to collect data. While valuable, this technology does not always create accurate visualizations. By requiring the usage of a smart device, the system can lead to holes and missing or skewed data. That’s why beacons are shifting to a new method. Here, a beacon acts as a gateway, directly funneling data from ordinary beacons to the cloud. This transfers data automatically without the interaction of a smart device to the cloud where it can be stored and used.
Beacons Need Gateway for Better Heat Map Generation
There is no one way to generate a heat map. A firm must consider costs and returns in order to find the best solution. The cutting edge gateway technology, however, does represent the most automated and affordable system for heat map creation. The hardware itself is very simple, relaying information about beacon location to the relevant system in the cloud.
The Kontakt.io Gateway works with the Location Engine, a software that can turn raw data into visualizations. Here, users will find the option to generate and view heat maps. This software is of huge importance to the gateway technology. Offering a user-friendly interface, it enables managers, executives, and non-techies the ability to utilize heat map technology quickly, easily, and digitally. Moreover, this technology is easily implemented into other apps, allowing solution providers the chance to quickly and effectively add heat mapping software and other beacon capabilities to their offerings. This should increase the overall number of beacon solutions for end customers as well as future heat map software capabilities, strengthening the beacon market while also lessening the headache and work.
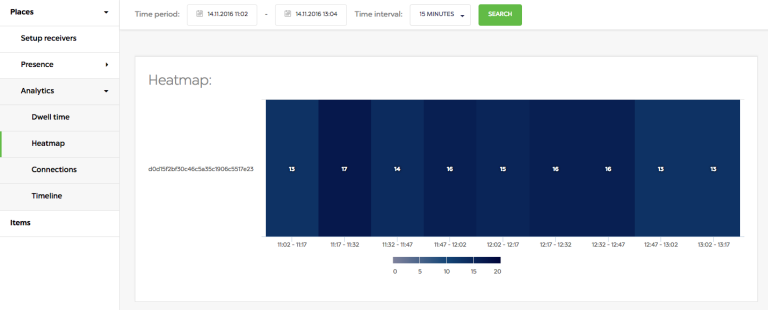
Location Engine Heatmap can show which Gateway beacon scanned the most devices in a particular time period for a given time interval, which can be set to 1 minute, 15 minutes, or 1 hour, for the selected time period.

Use our API to build up your platform
Our Location Engine API was designed to help you create better products for your customers. The heatmap data generated here can be easily integrated into your products so you can add the value your customers need. Our simple heatmapper was made to be built upon, ensuring that the result is the best, most appropriate interface possible.
Due to the technology’s simplicity and ease of use, it is relatively painless to perform and evaluate a POC for your particular project. In fact, before deciding on any one heatmapper infrastructure, it is crucial to test the most viable options. Get in touch to build a POC or test out heat mapping with Kontakt.io.